Nvestiv
Investing in Intelligent Design
Project Overview
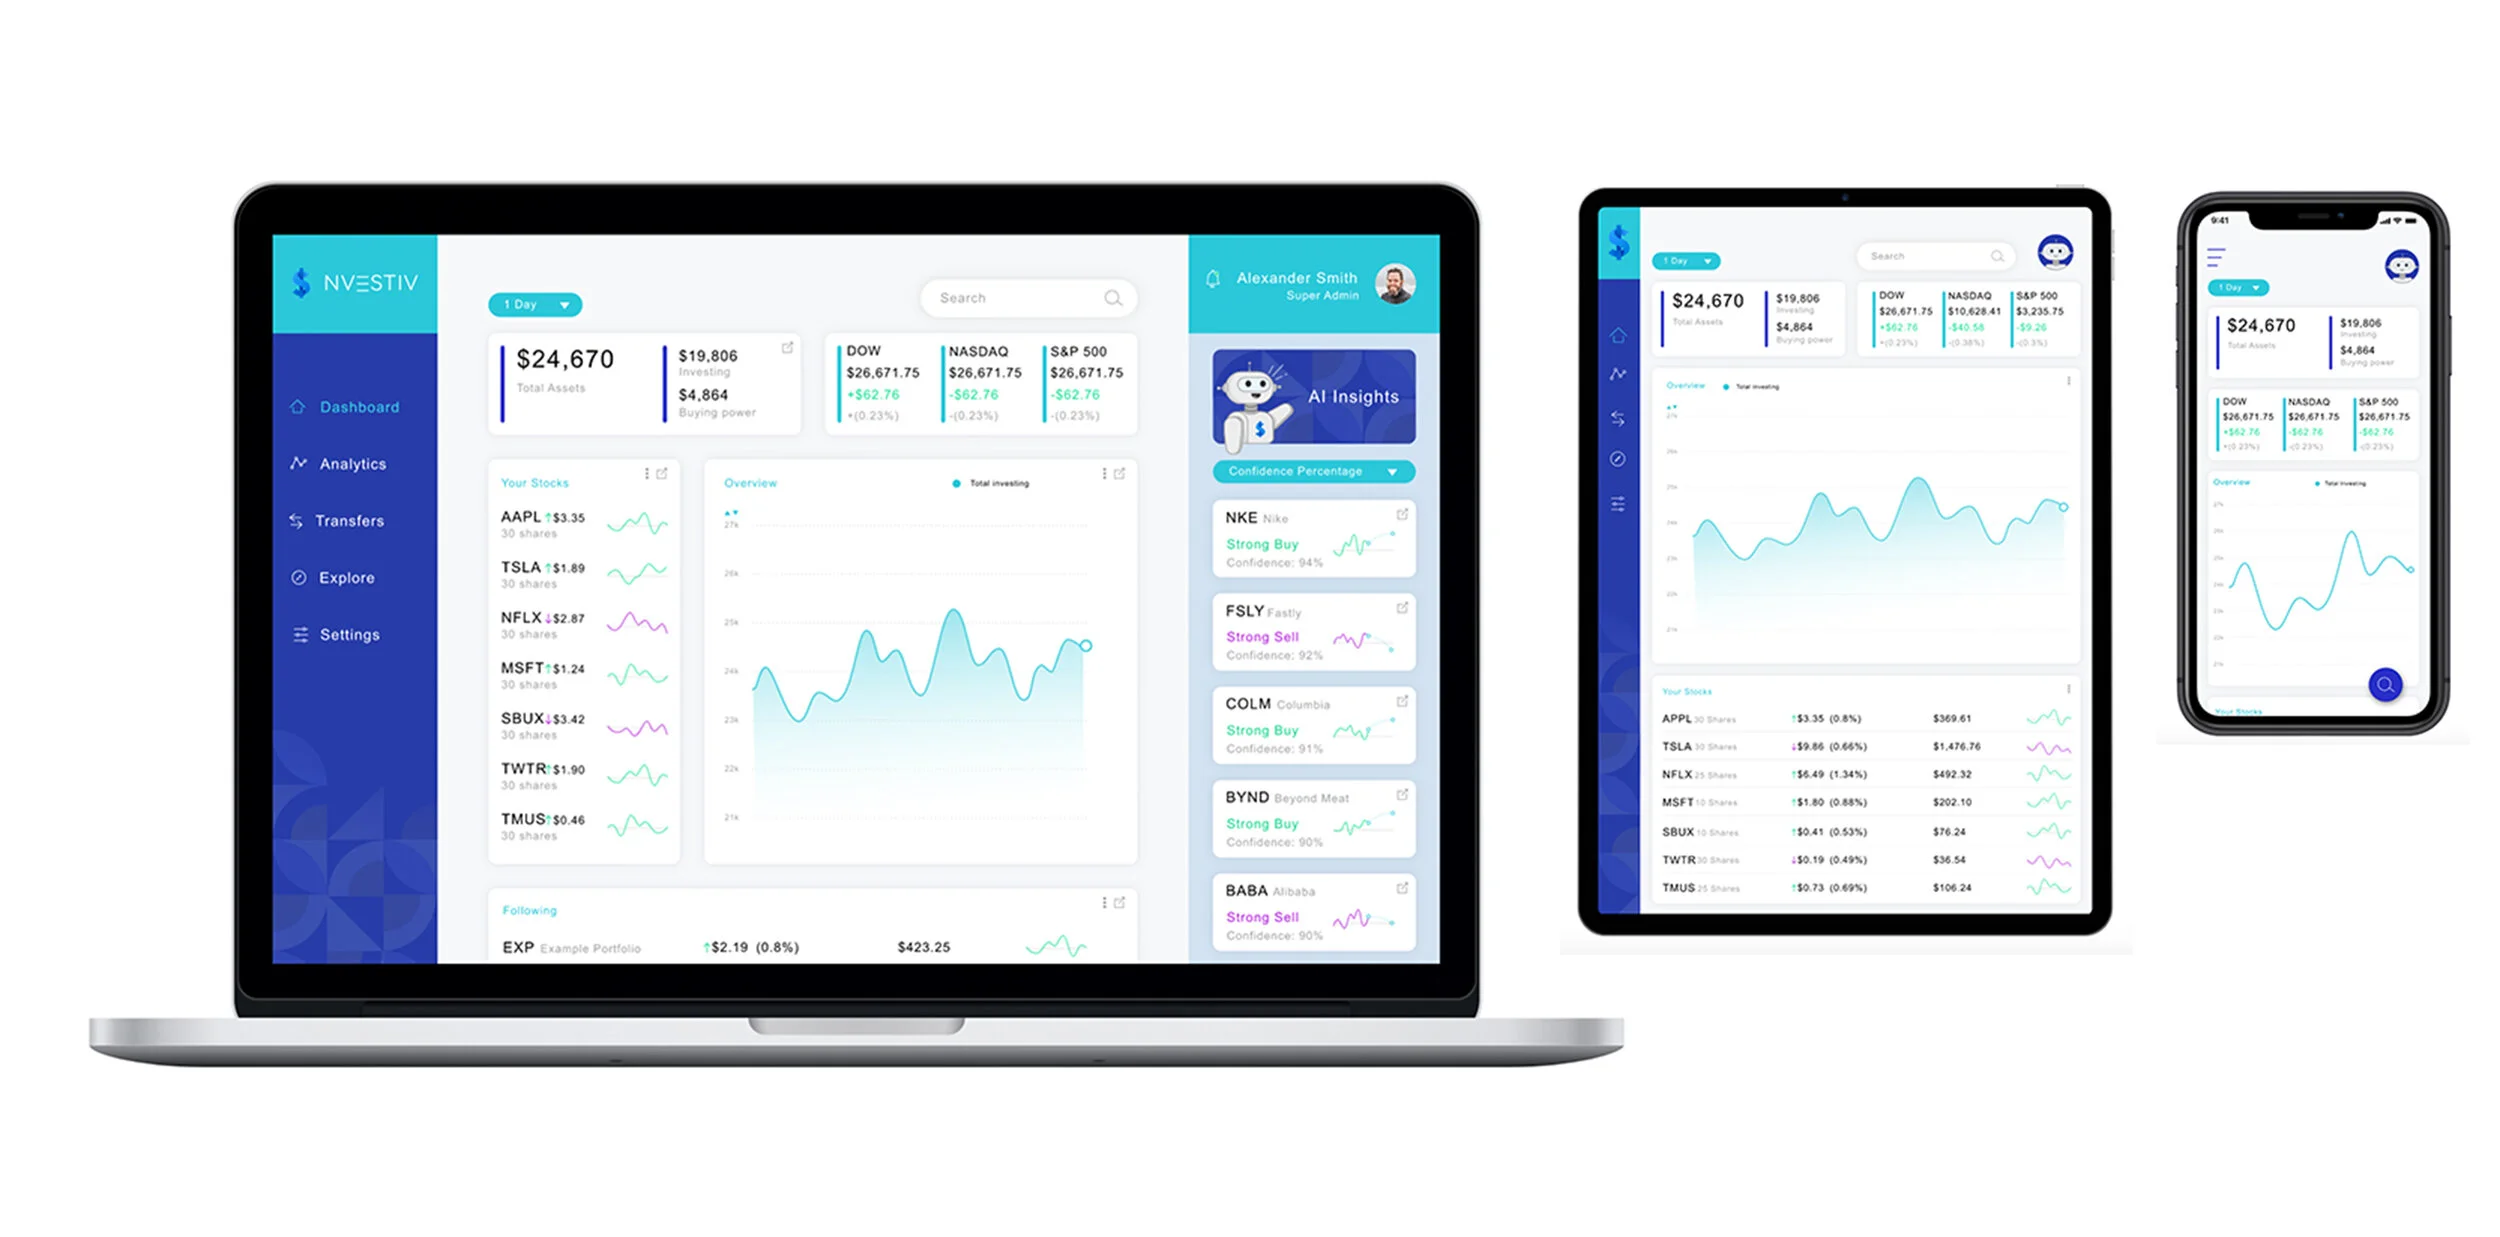
Nvestiv is an artificial intelligence (AI) solution designed to predict profitable stock trades using a complex algorithm. Easy to understand, real-time alerts filter out market noise and recommend trading opportunities with the greatest profit potential. Nvestiv learns through experience so the more it analyzes the better it gets. The resulting quality insights can then inform and direct novice investors.
My Role
Product Strategy
User Research
Branding
Interaction
Prototyping
User Testing
Client Ask
Nvestiv wanted an interface for their investing software that offers an appealing and seamless user experience.
Problems to solve:
People are too busy to research stocks
Stocks are risky, and that makes it hard to commit to trades
Too much and often contradictory data make trading decisions stressful
Complex analyses need a simplified format for users
Project constraints for the interface:
Customizable and complete with charts and the user’s investment performance.
Simple and easy to use offering a robust view of data and statistics.
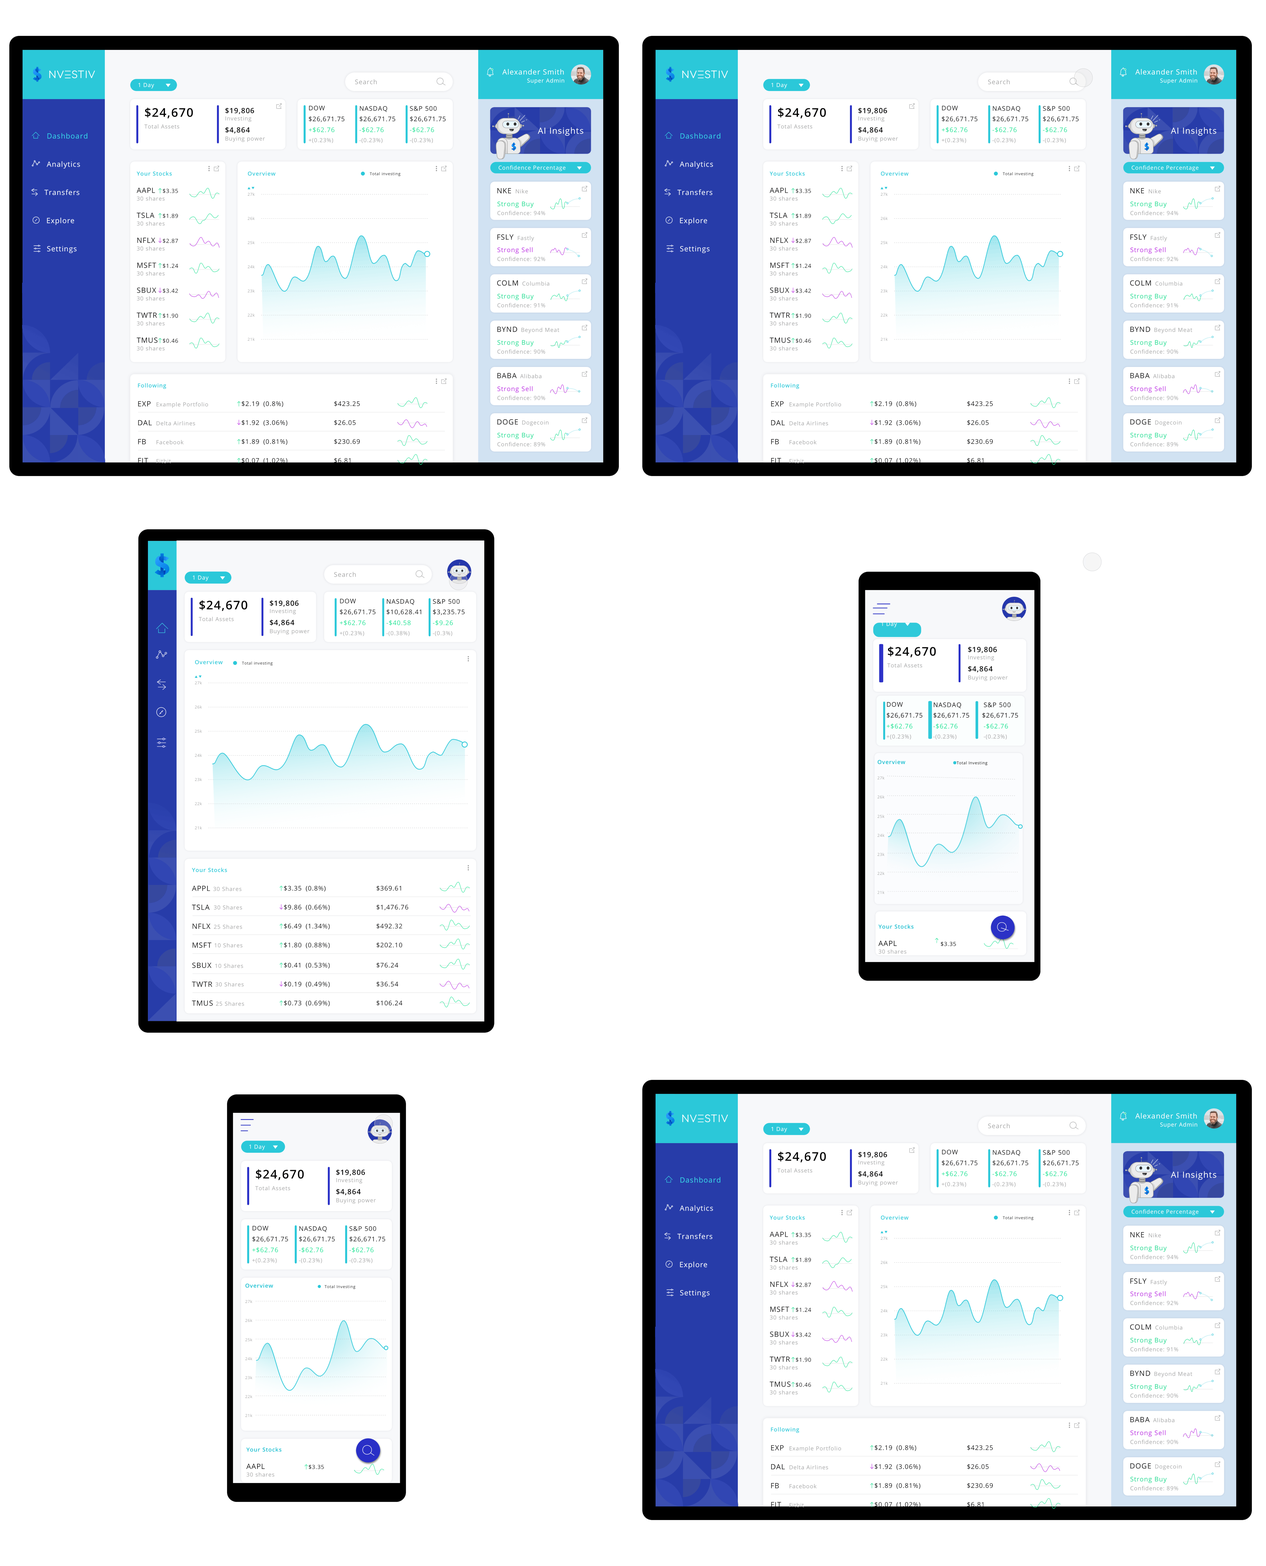
Easy to change screen views easily.
Strategy and Goal
Strategy:
The strategy of this trend detection software is to make trading faster, more efficient, and more lucrative by using machine learning to gather and analyze data to make intelligent predictions about market trends. This process will save the user time, and add confidence to their transactions. Nvestiv will have a simple, easy to use interface in order to make this process stress free and enjoyable. The user will have clear, customizable charts on the interface which will allow them to check their progress at a glance. Nvestiv will make the normally difficult stock trading process stress free by offering cutting edge insight and a good user experience through the whole process.
Goals for the interface:
Easy to use
Visibility for users
Effective and profitable
Research
Who is the user:
People between the ages of 25-45, all genders, employed with a college education.
Competitive analysis:
I compared Trade Ideas, Trend Spider, Blackboxstocks, EquBot, Kavout, Robinhood, Etrade, Infinite Alpha, Tech Trader, Algoriz, and Fidelity. Some things they did very well while others could be improved. This research allowed me to learn from their best and improve on their worst.
User Interviews:
People’s attitude toward AI investing mostly fell into four categories, positive, negative, didn’t understand AI, and those who had bigger picture concerns. People who were positive on it seemed genuinely excited about the possibilities of AI and were interested in technology in general. Those who were negative on it seemed like they didn’t care much for technology, and didn’t look towards new innovations to improve their lives or solve their problems. There were also people who didn’t seem to understand or trust AI. Lastly, some of the people worried about the ramifications of AI. Some of the major concerns were loss of jobs, loss of human control over computers, and artificial stock market manipulation.
Device Research:
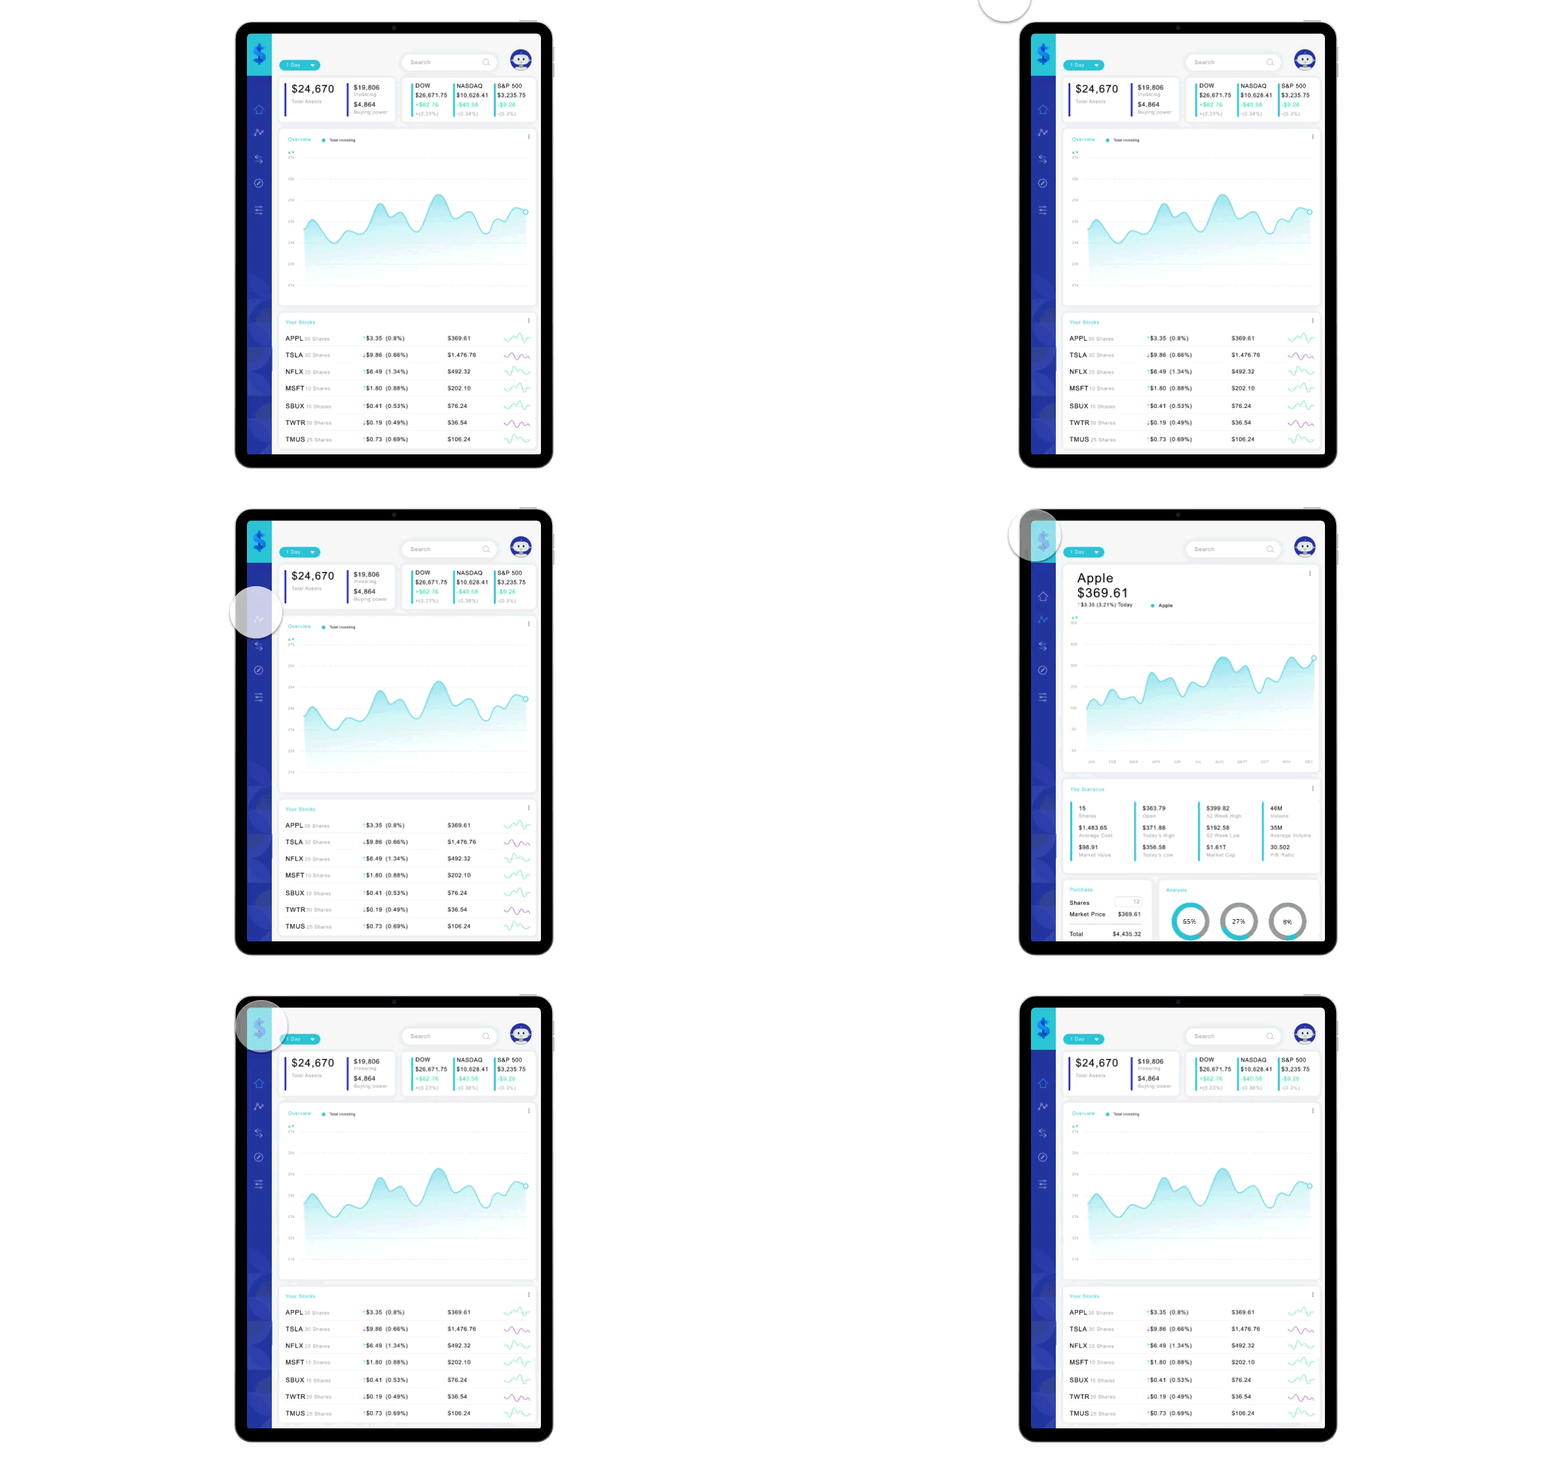
While designing this project, I kept in mind what devices the user would most likely use for managing their investments. Although mobile use is on the rise, people are more likely to do important tasks on a desktop computer. Time of day also affects what devices people will be using. People are more likely to be using mobile in the morning and evening, and desktop during the day. Stock trading is an important task, and usually happens during the day so the software had to have a strong desktop presence. However, Nvestiv’s target market is younger and not professional stock traders. They would most likely trade outside of work hours so the interface needed to be designed for mobile use as well.
Usability for AI:
There is a lot of discussion on how to create bigger and better AI systems, but there is less focus on how we can advocate for the user in these systems. I wanted to make AI pleasurable to interact with. The following are some key takeaways from this research.
Separate out AI components visually: If a user can clearly see what information is coming from AI, they will be more likely to trust it. This transparency makes the user feel more in control using the interface, and using AI.
Educate users about AI: Understanding AI will add to the user’s sense of control.
Manage expectations: Use data transparency to let users know what the system can and can’t promise.
Encourage forgiveness: The technology isn’t perfect and will make mistakes just like a human. Design for that in the UI. If the user likes the software and finds the UI pleasing, they will be more tolerant of mistakes.
Provide Security and Control: The AI shouldn’t do anything without the user’s consent.
Encourage Feedback: User provided feedback is very important to help the system learn and improve.
Sketches and Wireframes
Difficulties and Solutions
Challenge #1:
During my interviews, I found that people often don’t trust artificial intelligence. People often found the technology intimidating and dystopian.
Solution:
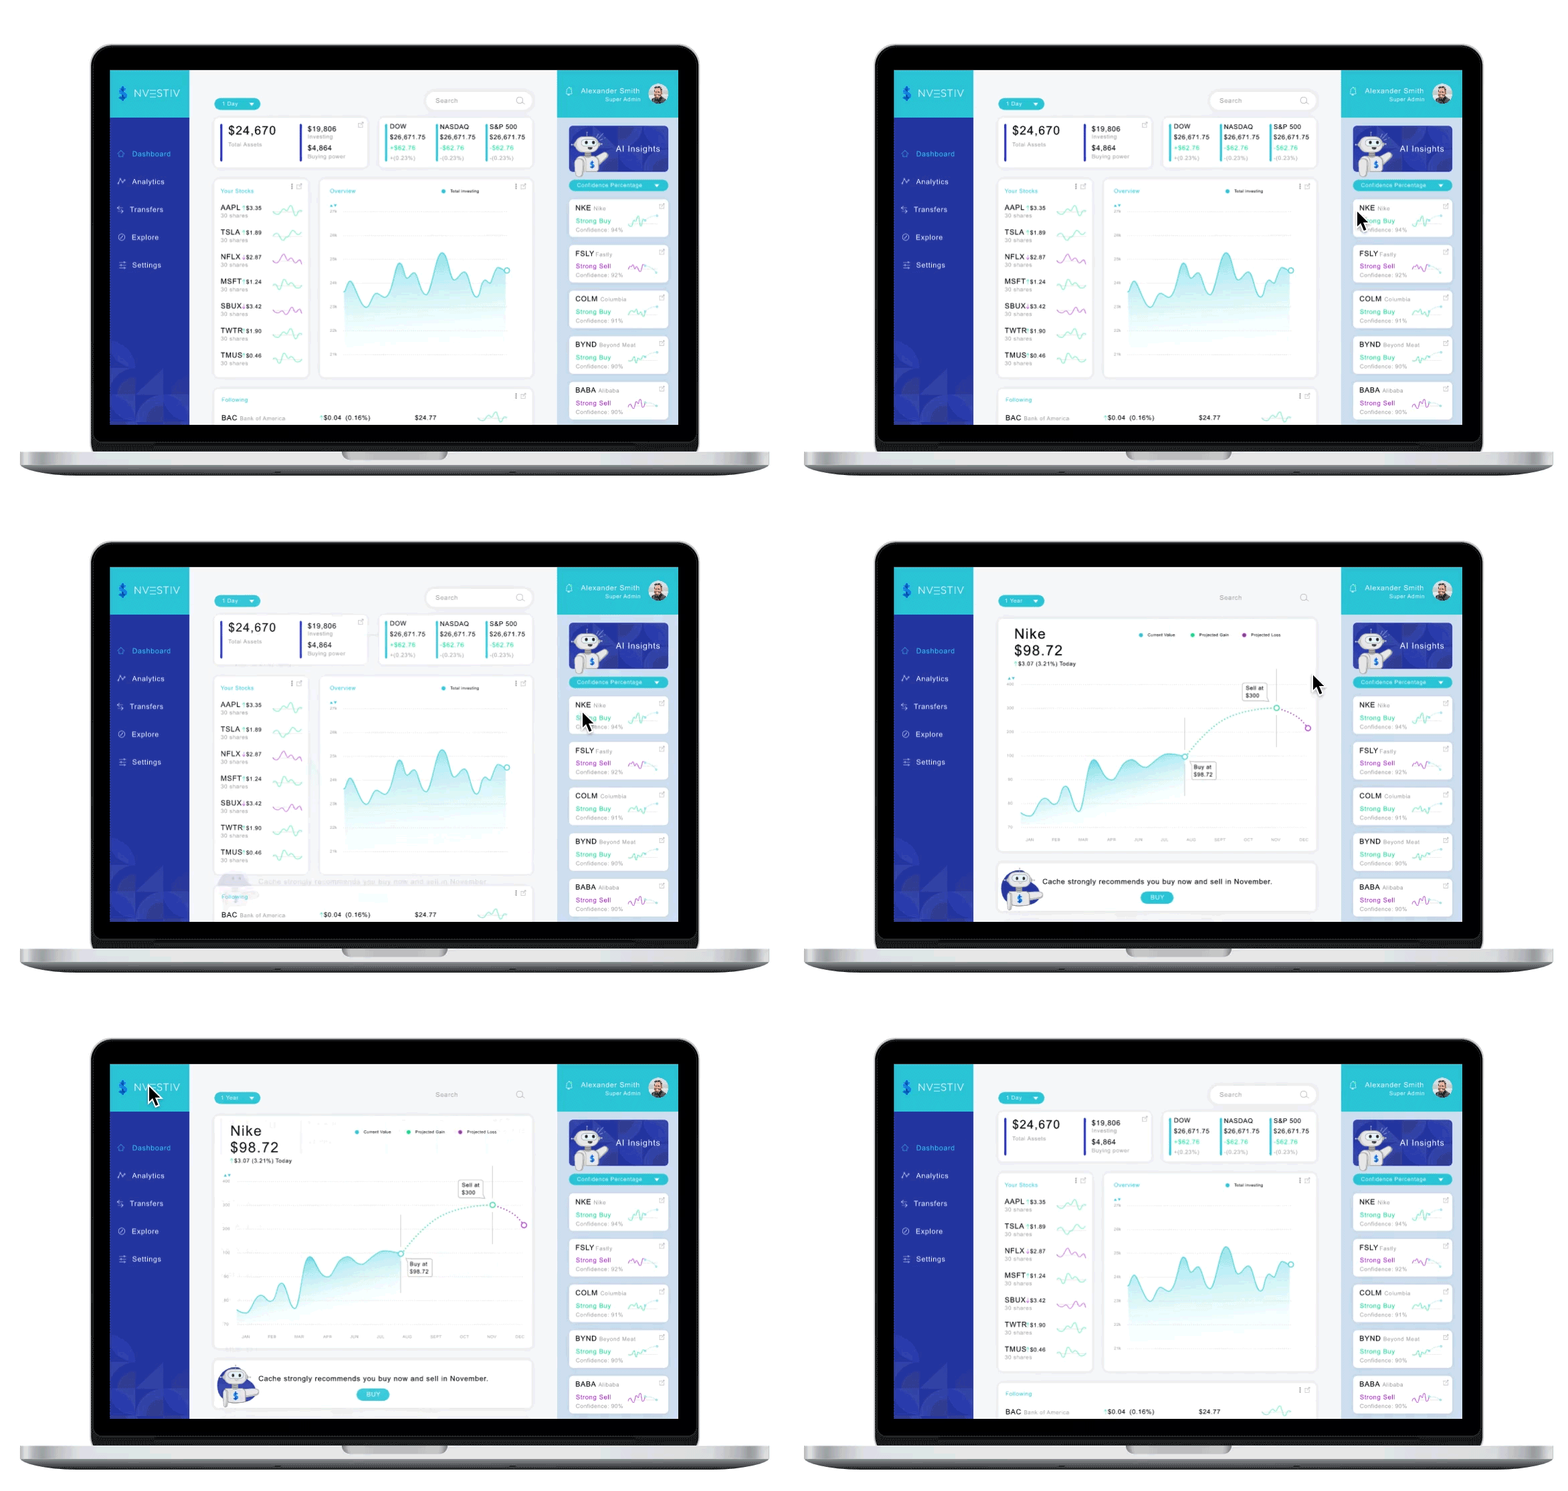
A mascot would endear users to the product and make the algorithm less intimidating. After trying out a few iterations, I created Cache, the adorable face of Nvestiv’s AI algorithmic system. Cache will not only endear the user to the technology, but will also encourage loyalty and forgiveness.
Challenge #2:
People want visibility into what the algorithm is doing in order to trust the predictions, but they also don’t want to be bogged down by complicated computer science.
Solution:
A section on the suggestion detail page explains how Cache came up with its prediction in very simple terms. This way, users can feel more comfortable with the prediction, and are assured that the suggestion is coming from a mathematical process.
Challenge #3:
Investors need the ability to view and compare many different stock trends quickly.
Solution:
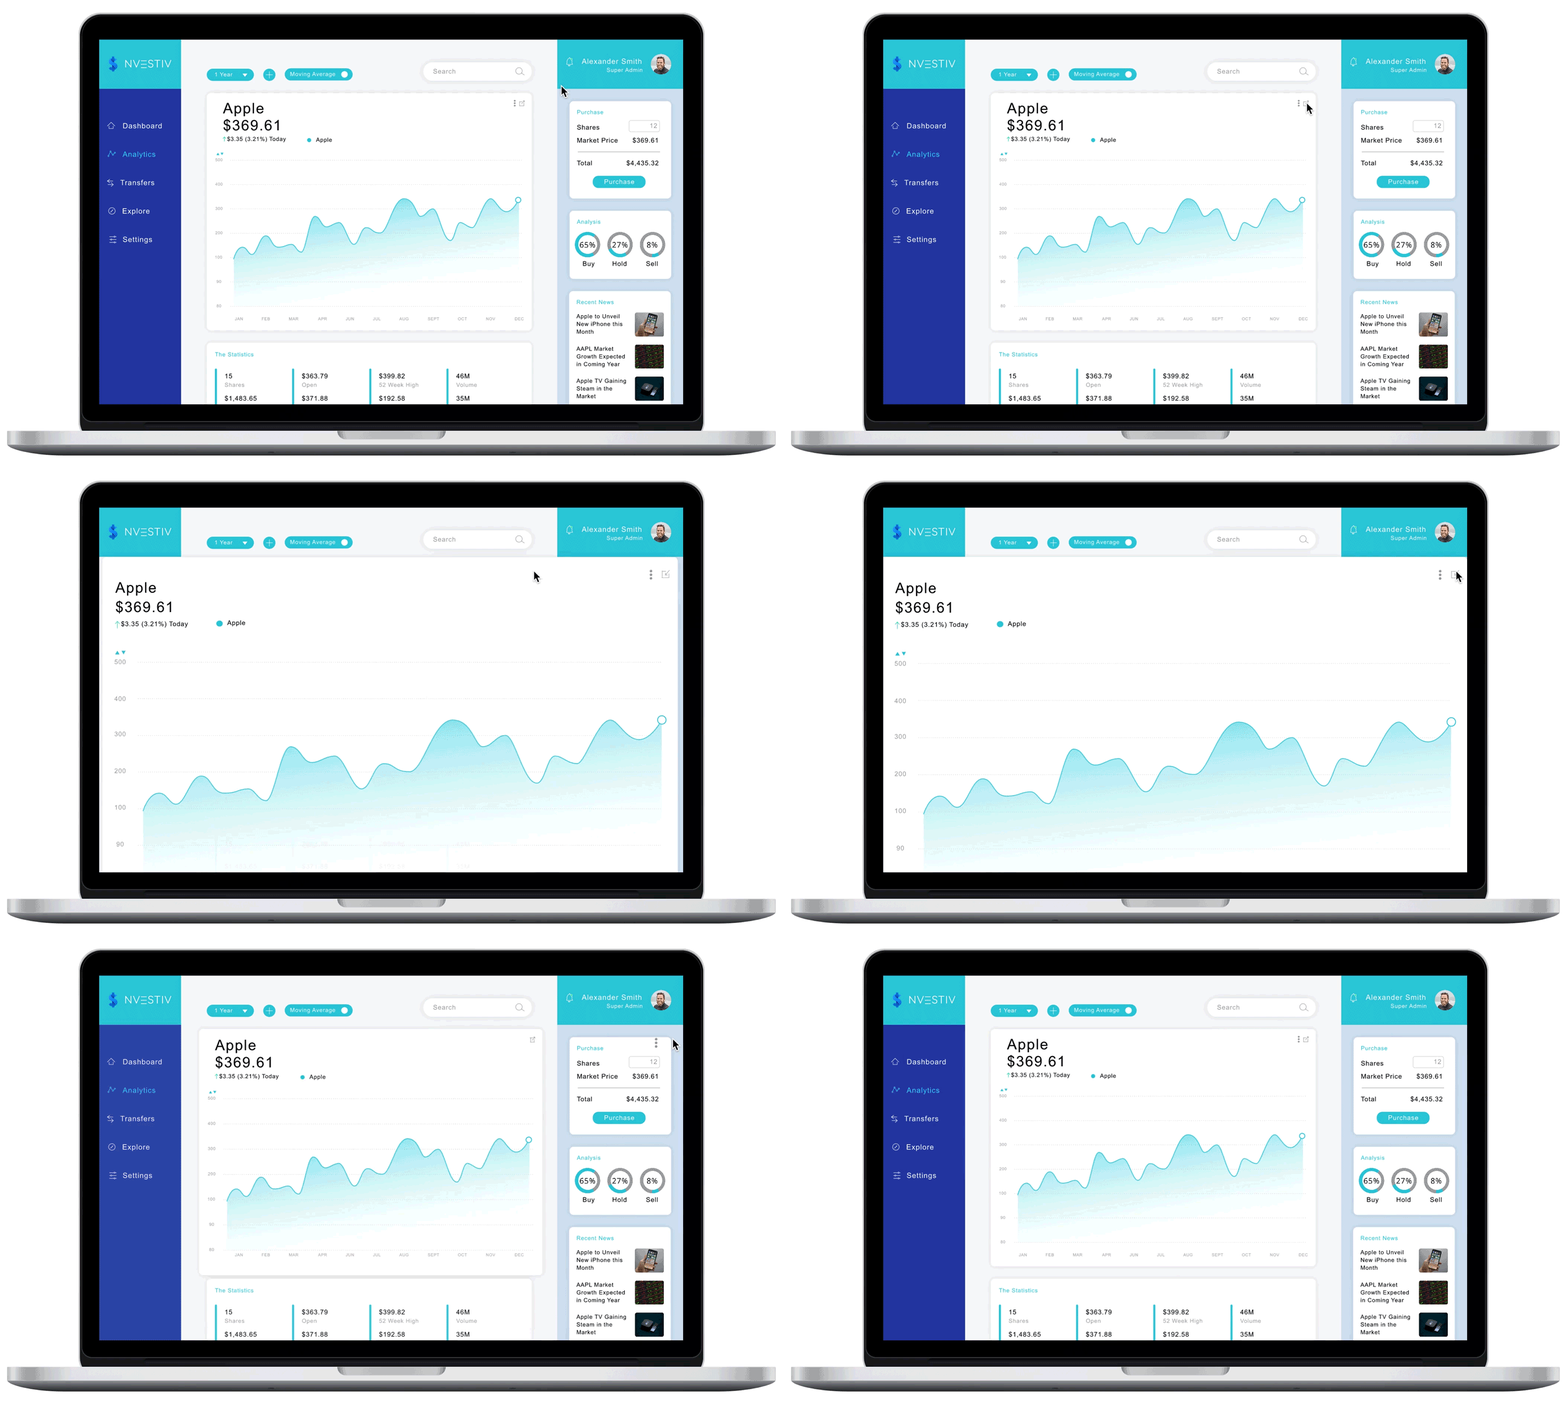
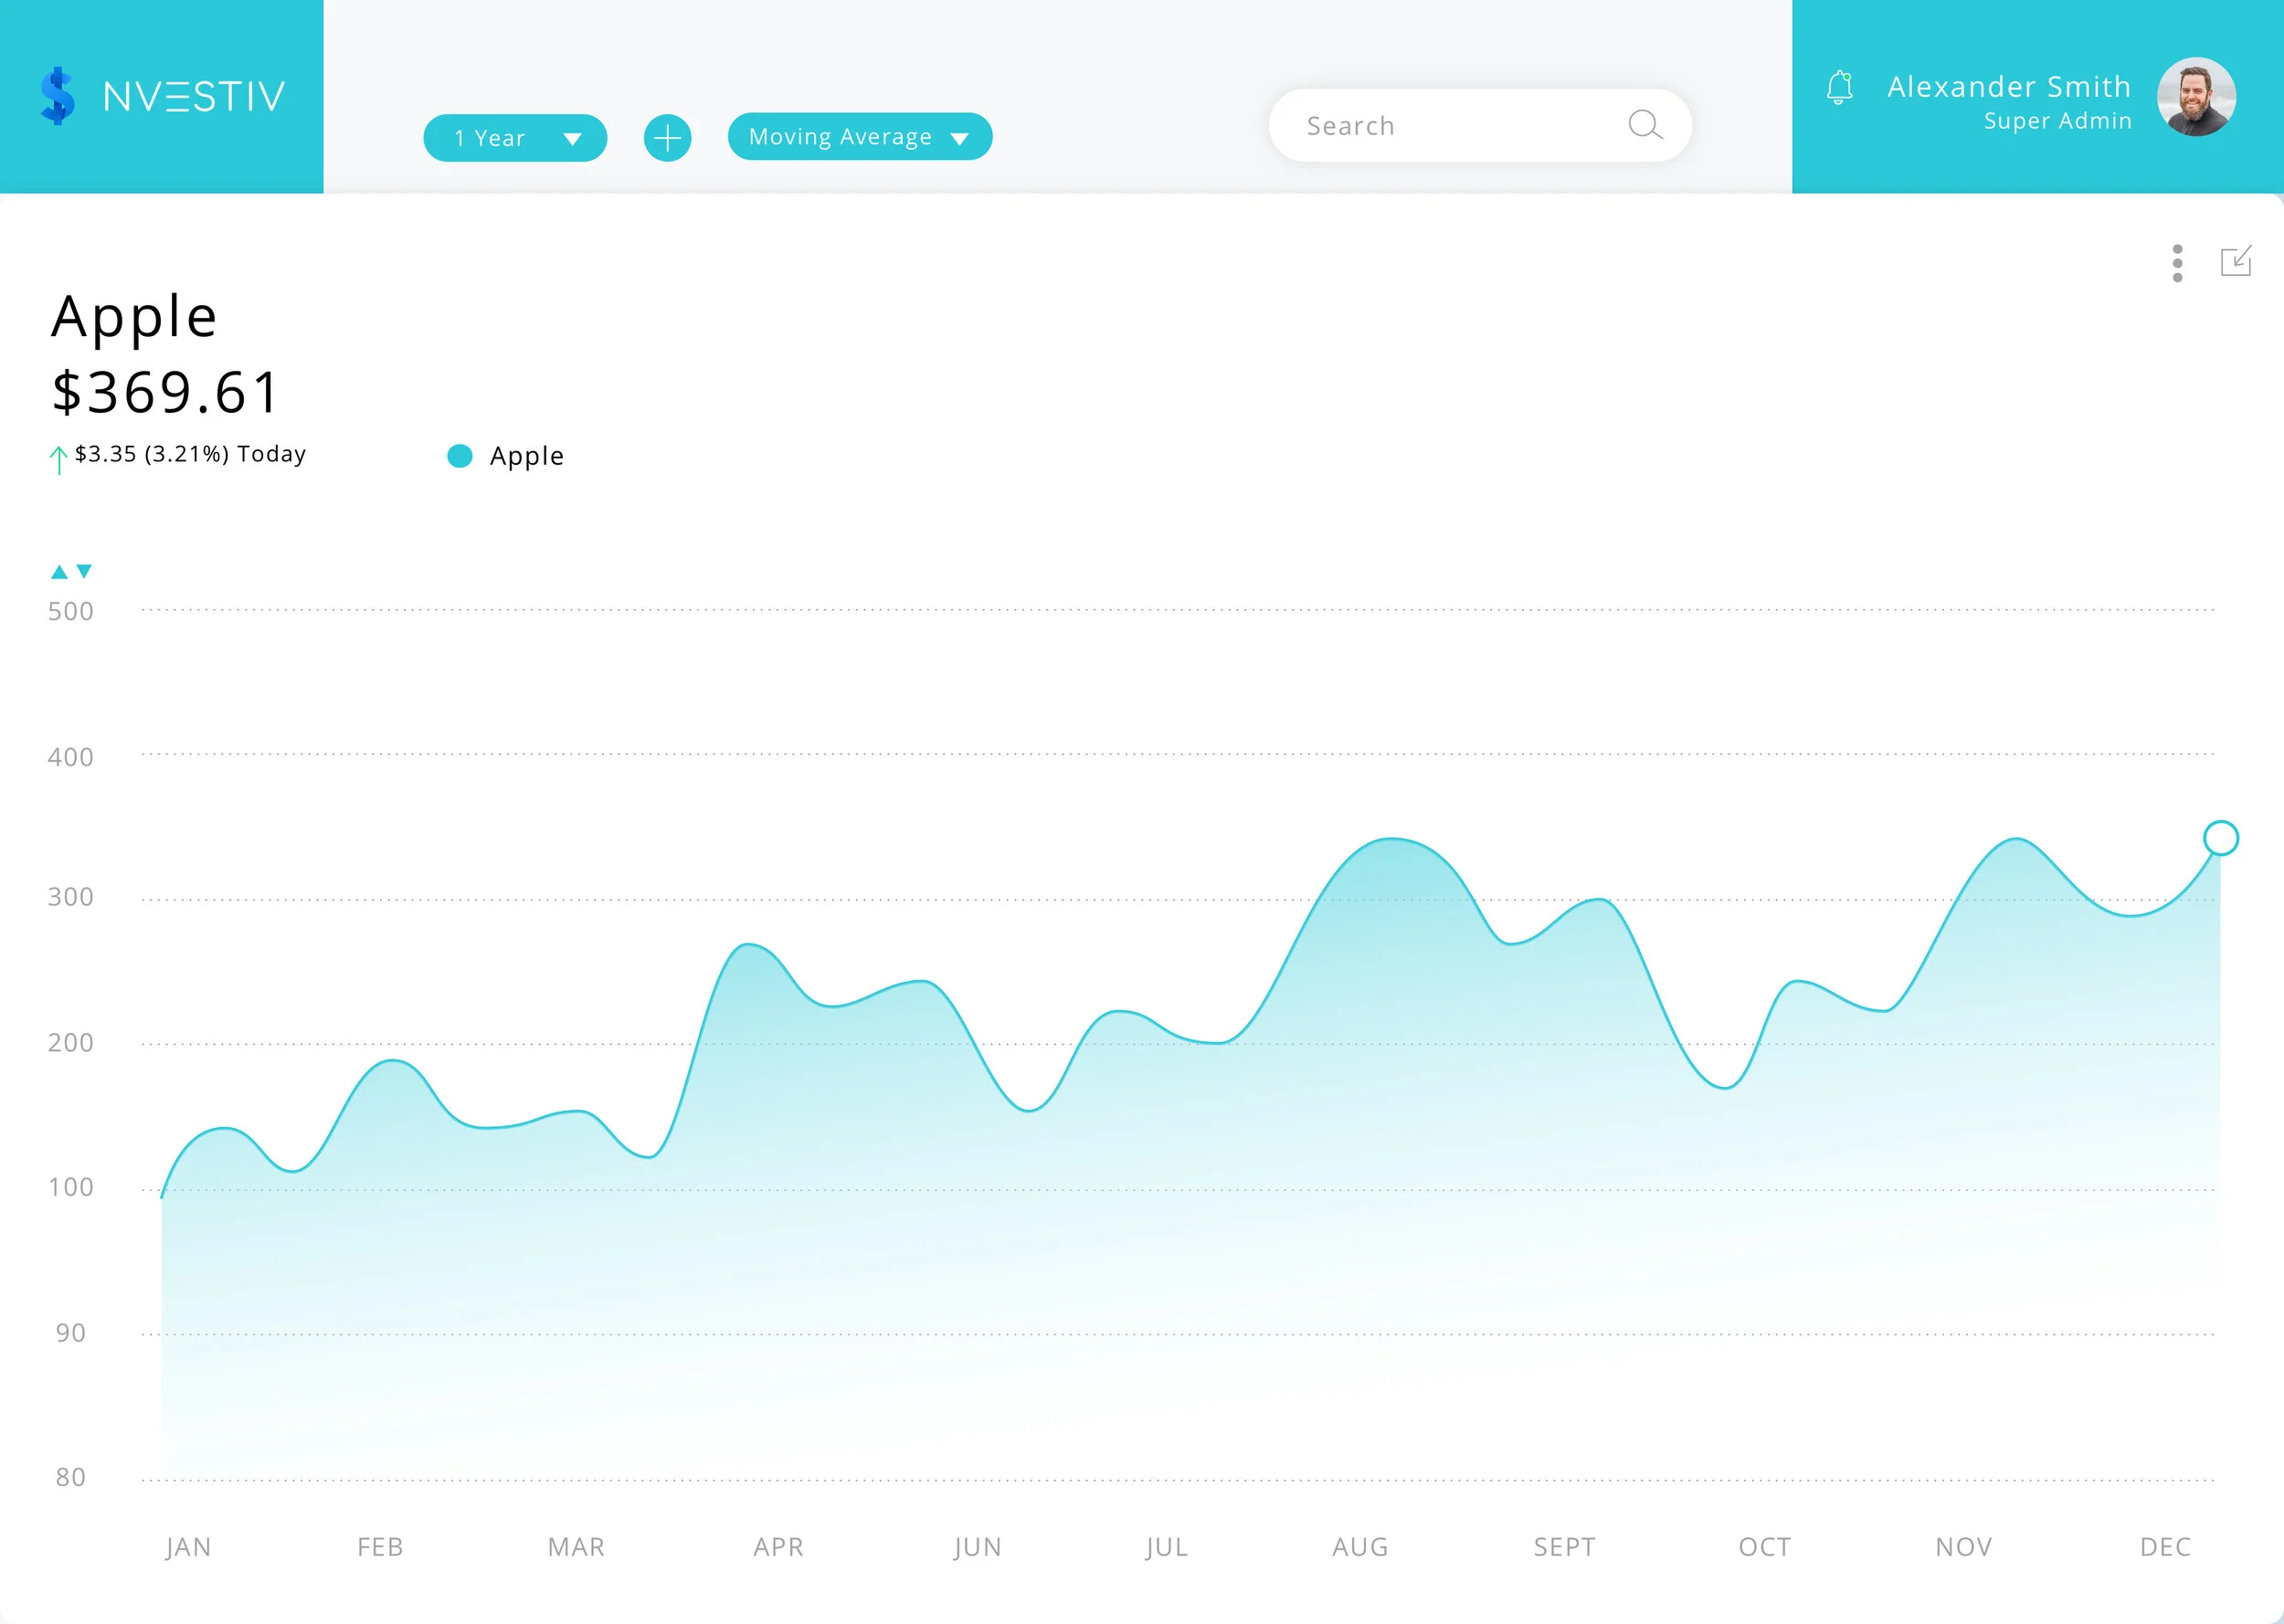
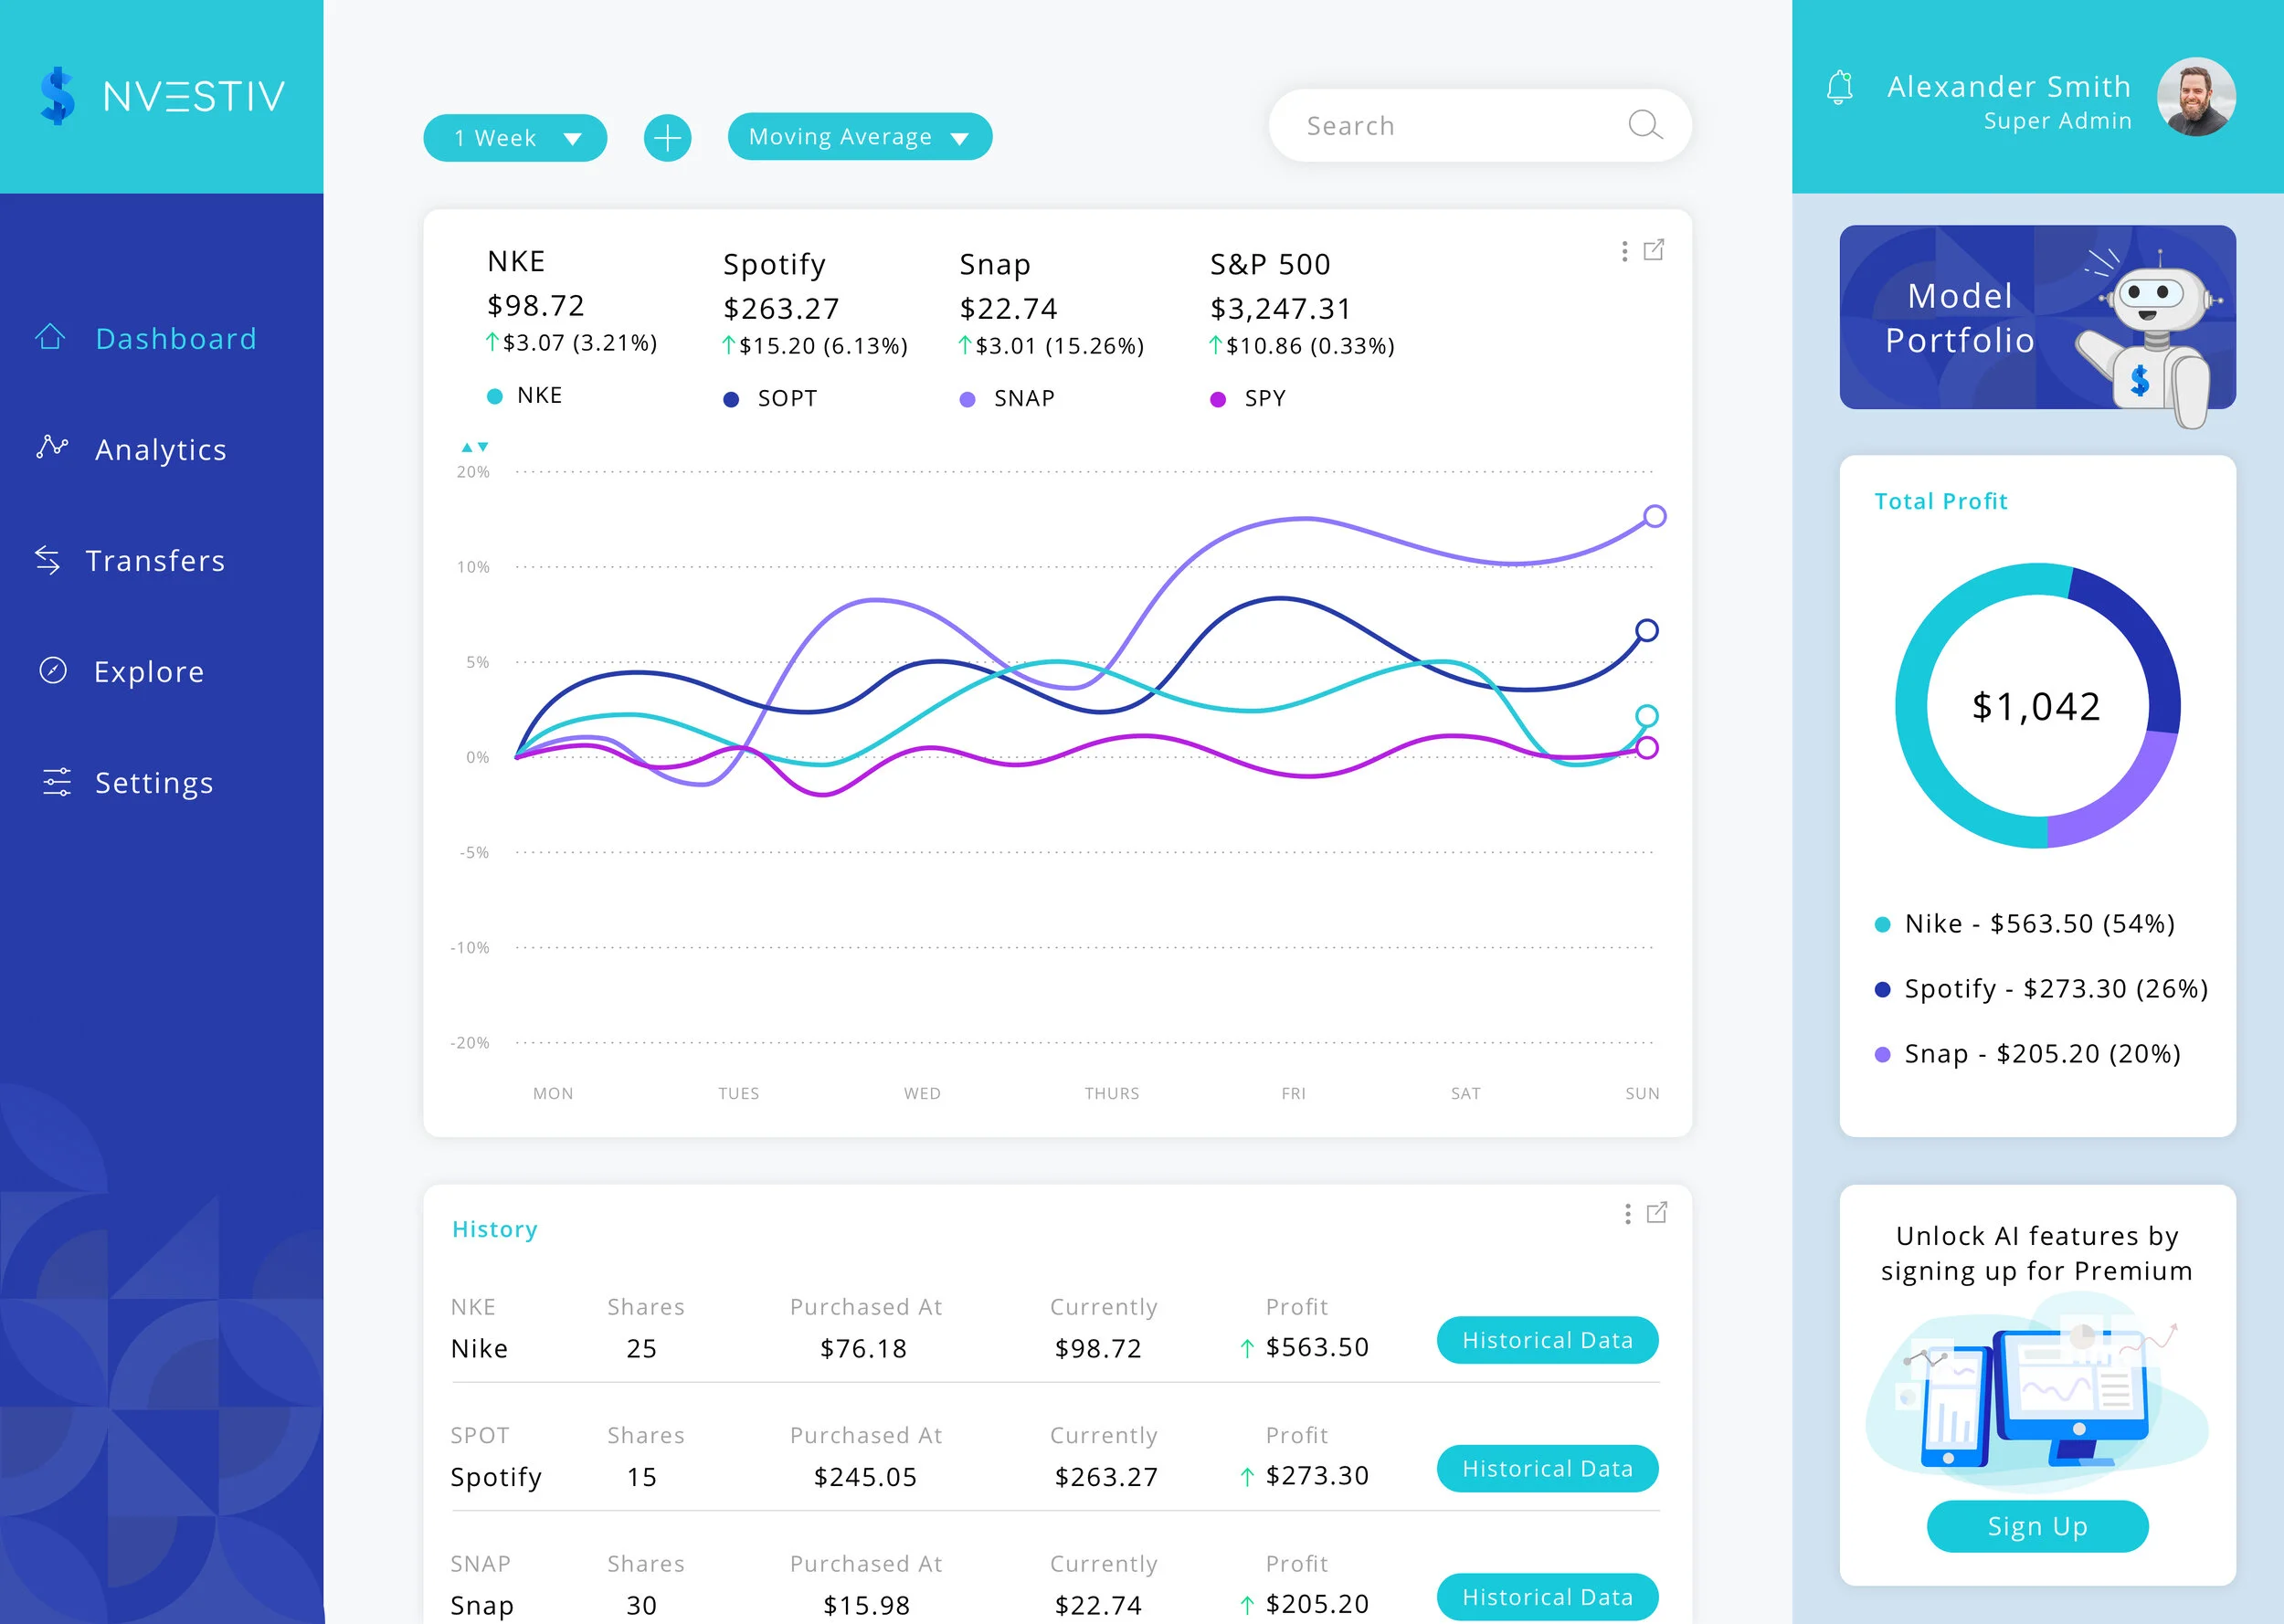
I included the ability to easily add, remove, and compare stocks, and toggle the moving average. This will allow the user to easily see all the data they need on one page.
Challenge #4:
There is a lot of data that goes into stock trading. Since the specific details are as important as the general information, they need to be easily accessible through the interface.
Solution:
I added the ability to hover or click anywhere on a line to get details, easily change time periods, as well as arrows to change money increments. Users can easily customize the interface to get the data they need.
Challenge #5:
Include all the necessary data while having a clean, usable interface.
Solution:
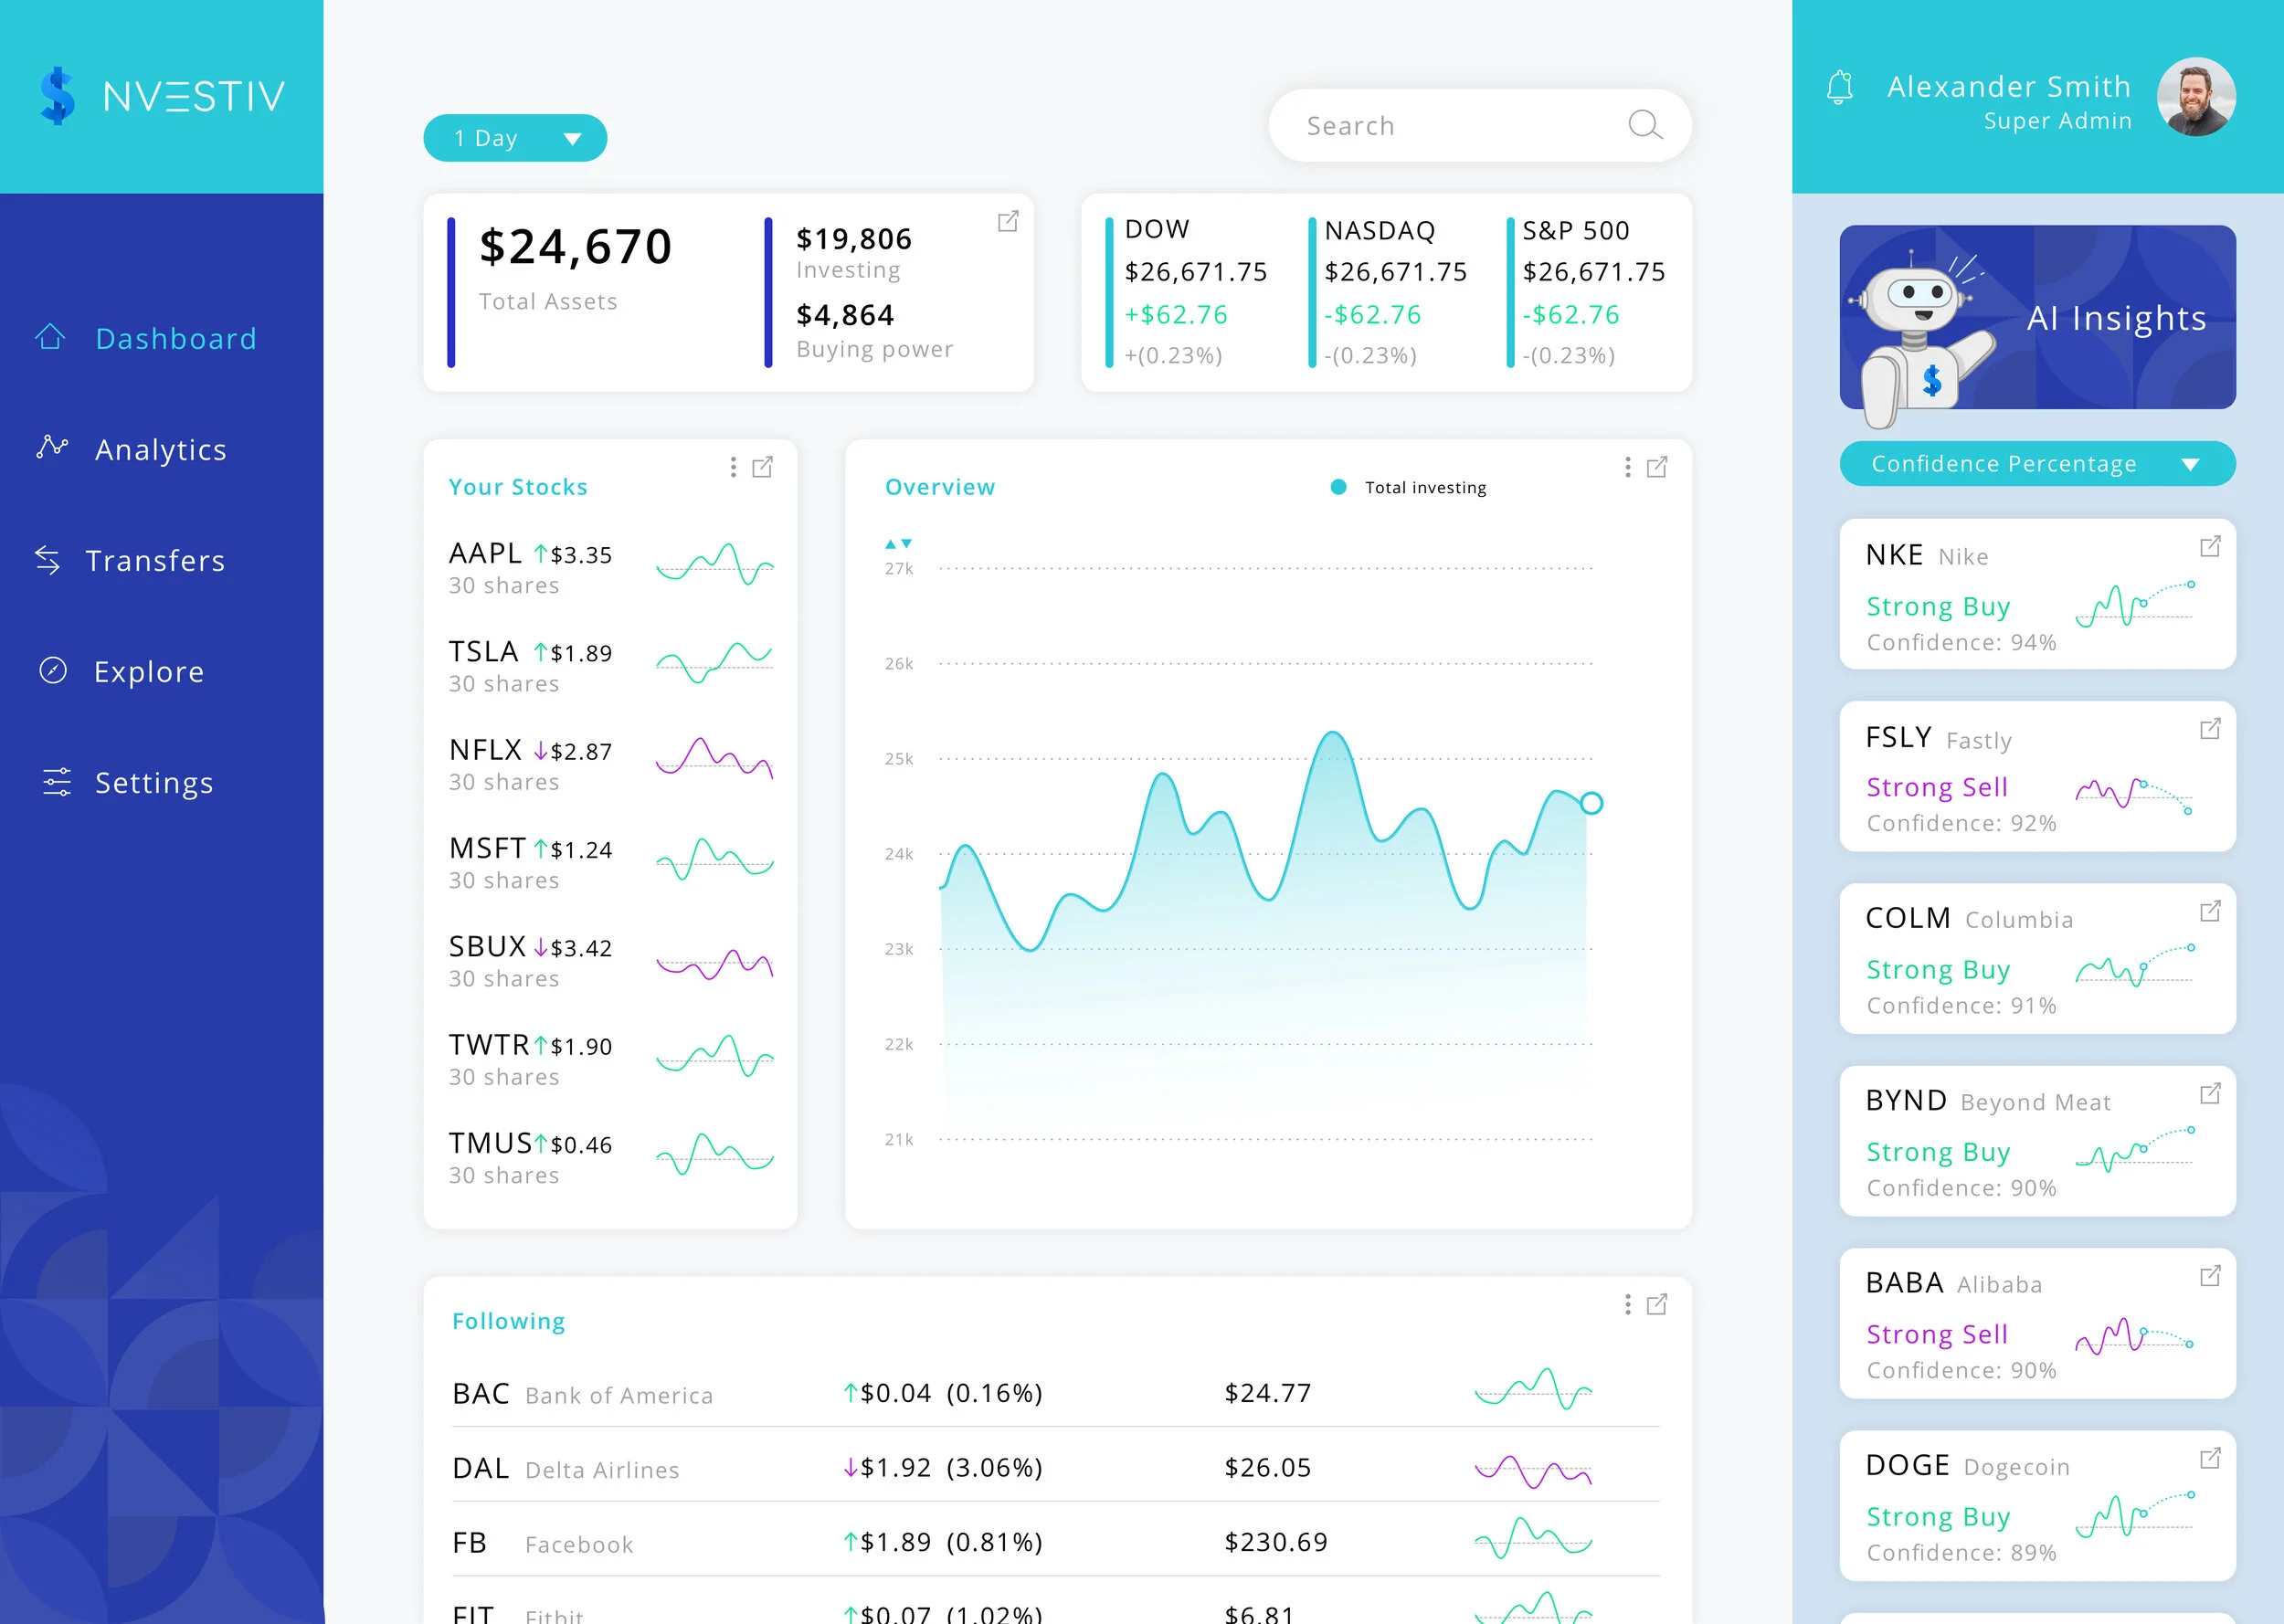
Having lots of data in a small area means that the space needs to be used efficiently. Using sectioning, contrasting colors, negative space, and minimal text I created an easy to read dashboard that contains the most salient information.
Challenge #6:
Lots of necessary statistics. All these numbers and data points make a page hard to read.
Solution:
The statistics are laid out neatly, and easy to read. All charts are expandable allowing the user to get all the statistics on the page, then expand the graph for a more detailed view of the analytics.
Challenge #7:
Convince users that the AI predictions are trustworthy.
Solution:
Users can keep track of a model portfolio which would allow them to track its performance. The performance of the model portfolio would be compared to S&P 500 stock index. The difference between the two would be the quantitative value and the validity of Nvestiv.
Mockups
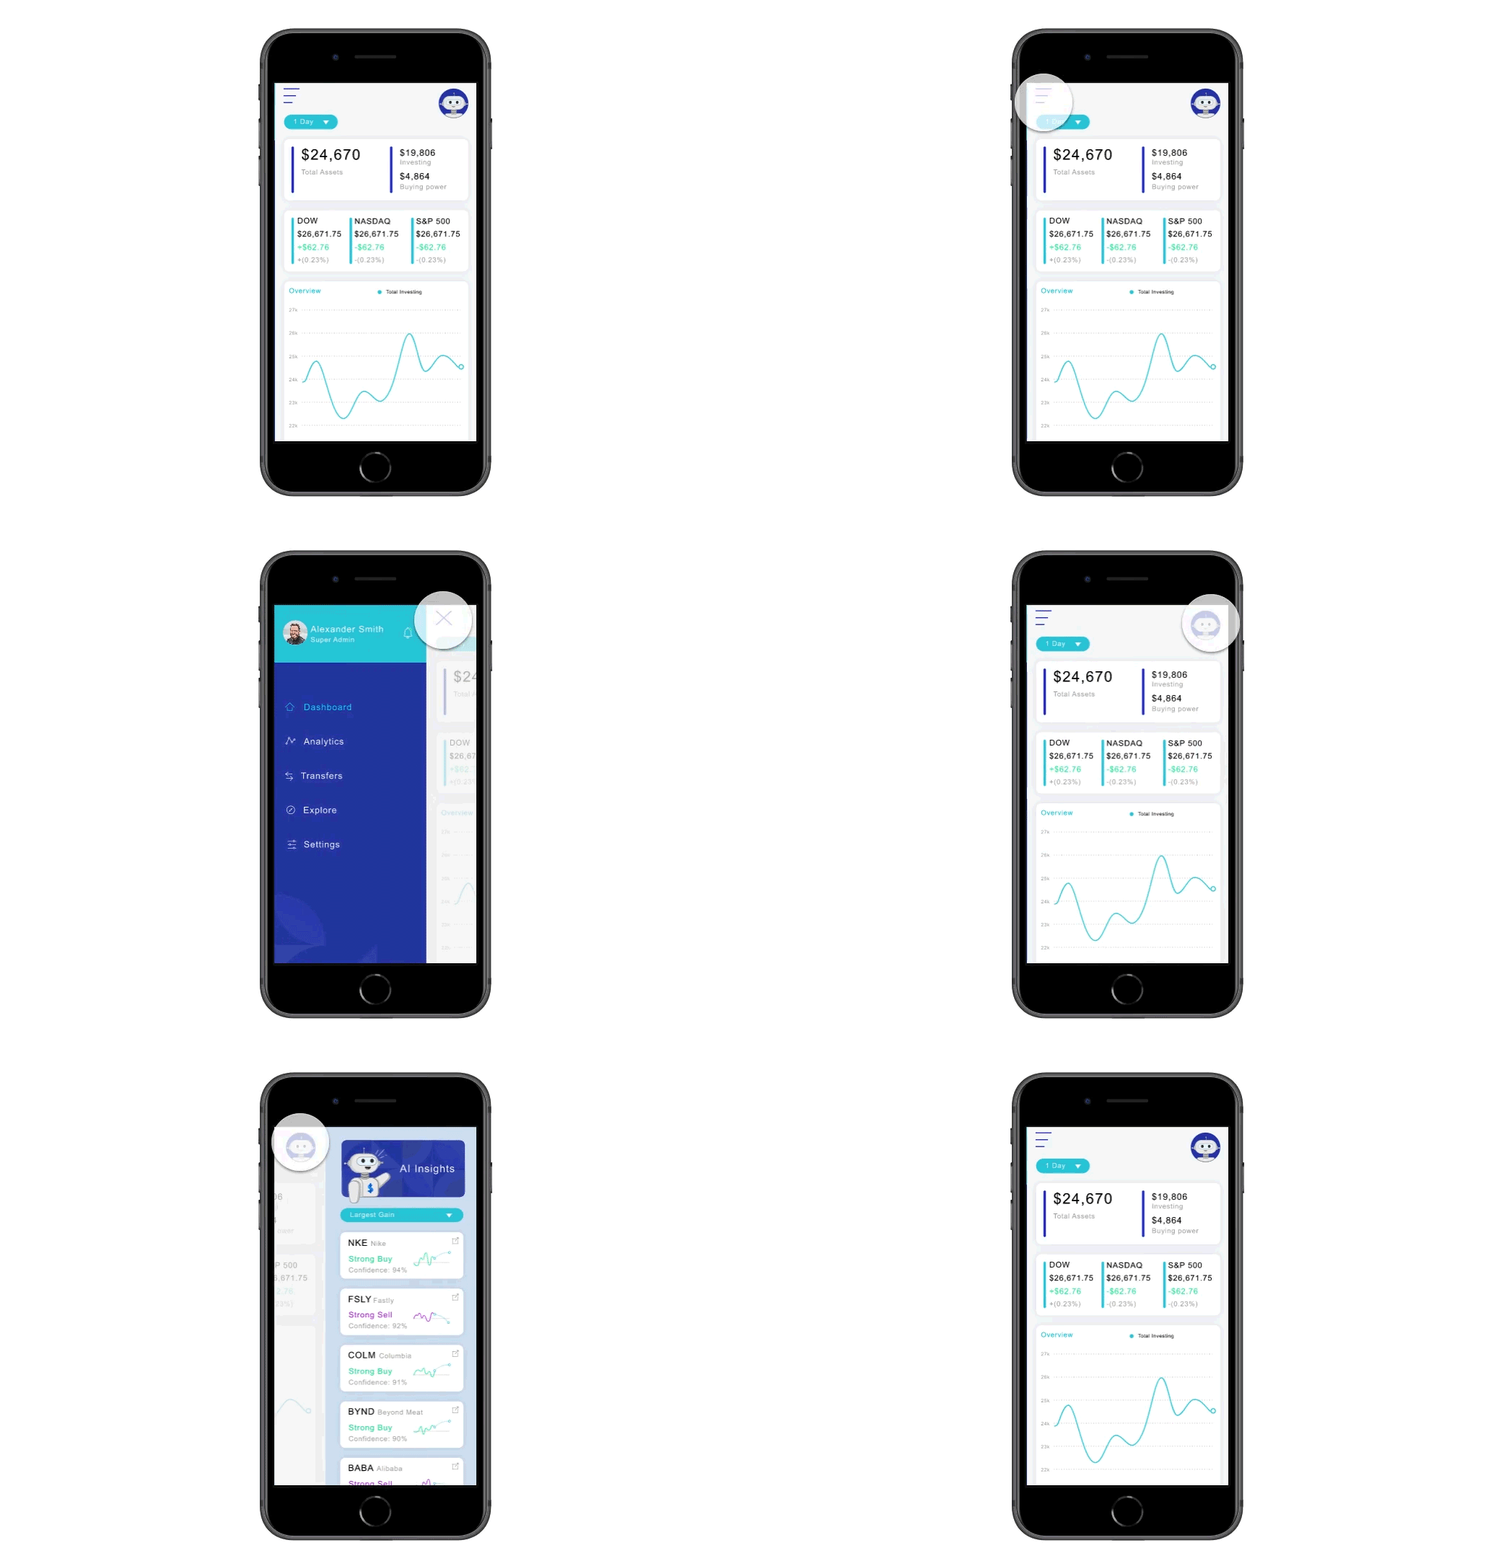
Once the design and flow were nailed down, I created mockups complete with color palette, images, typography, and icons. This process allows for experimentation with the visual design, and getting stakeholder feedback.
Prototypes
Making clickable animated prototypes allows users to be able to test the working product. This process is also important so developers know how the product should look when interacted with.

